How to recognize and trade different Forex chart patterns
Contents:Types of charts CandlesticksChart patterns| The very first look at a newly opened chart usually gives traders a little or no clue what the market is currently doing. 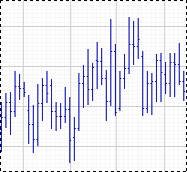
It usually appears like that wavy indefinite graph you see below. A trader must «reorganize» it into a very clear picture to be able to trade. Analysis usually starts with defining the trend.
It may be needed to switch to a bigger time frame (hourly, daily) to see where exactly the market price is heading: up or down. |
Having done that a trader can plot a trend line.
Note the rule of placing trend lines for uptrend and downtrend. 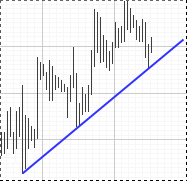
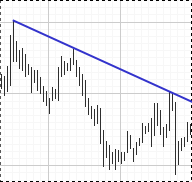
For uptrend a trend line is plotted below the price action to indicate a support level. For downtrend — above the price action to mark the level where resistance occurs. For more information about trend lines visit: http://www.forextrendline.com «Always trade with the trend»... or at least try to — the gold rule in trading. That's why we want to find a direction of the trend. |
| Price can form channels. A channel is a corridor with parallel lines in between which the price moves. The longer the price stays in a channel the stronger the channel becomes. 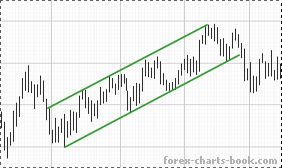
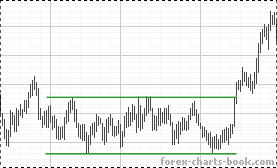
Trading strategy: watch for the price attempting to trade out of a channel. Once the first bar is closed outside the channel it is time to execute a trade in the direction where this break-through has occurred. |
Autochartist is a powerfull tool to help scan and recognise Chart patterns in real time.
Find more with Autochartist Forex Brokers