Candlesticks
Contents:Types of charts CandlesticksChart patternsCandlestick charting uses rich terminology to describe different candlestick formations.
| Description | Live chart |
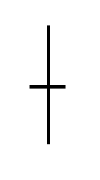
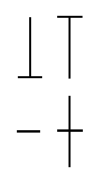 Doji candle has no or an extremely short body and long shadow(s). It is formed when buyers were unable to overcome sellers' pressure and push the price any further from an open point, and at the same time, sellers met strong buyers' pressure and also didn't succeed in their efforts to push the price down from the open point. The result is a draw: open price = close price. Doji candle has no or an extremely short body and long shadow(s). It is formed when buyers were unable to overcome sellers' pressure and push the price any further from an open point, and at the same time, sellers met strong buyers' pressure and also didn't succeed in their efforts to push the price down from the open point. The result is a draw: open price = close price. Doji candlestick signals of possible market turn / price reversal, especially when spotted after a long preceding candlestick (bearish or bullish) in a strong trending market. However it can not be used along. The confirmation (next following candlestick) is needed to reassure that market has changed its direction. Tip: If doji appears at previous support / resistance levels (e.g. trend line, price channels, fibonacci retracement, pivot points etc.) its importance gains additional strength. | |
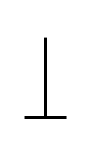 Gravestone doji gives a strong signal when appears after a long bullish candlestick at the top of an uptrend. It indicates that although buyers were confidently trying to push the price up, eventually sellers gained enough strength to return the price to its open position. Gravestone doji gives a strong signal when appears after a long bullish candlestick at the top of an uptrend. It indicates that although buyers were confidently trying to push the price up, eventually sellers gained enough strength to return the price to its open position.A trader should consider taking profits and exiting if trading a long position, or place a tight stop below the close price. | |
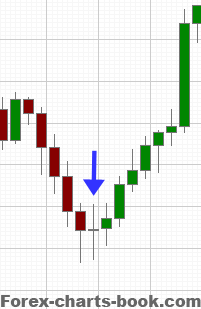
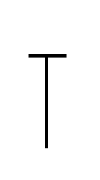 A dragonfly candlestick has open, close and high: all at the top. It should be treated seriously when spotted at the bottom of a downtrend while following after long red candle, as it signals that buyers have got enough strength to return the price from its advancing low progress to the starting open point. A dragonfly candlestick has open, close and high: all at the top. It should be treated seriously when spotted at the bottom of a downtrend while following after long red candle, as it signals that buyers have got enough strength to return the price from its advancing low progress to the starting open point. When trading short position a trader should think of an option to secure profits and close a position or set a protective stop tighter as a market can resume a U-turn. | |
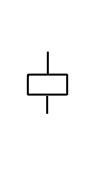
 Spinning top is more an indecisive candlestick, as neither buyers nor sellers had demonstrated their power and finished with zero progress. Spinning top is more an indecisive candlestick, as neither buyers nor sellers had demonstrated their power and finished with zero progress.When appears after a long preceding candlestick, this doji type always requires following confirmation (next candlestick should be bullish in the downtrend or bearish in the uptrend). | |
 A spinning top candlestick also is an indicator of indecisiveness between buyers and sellers. The color of the body here is not important. A spinning top candlestick also is an indicator of indecisiveness between buyers and sellers. The color of the body here is not important. Several spinning tops going one after another indicate a current stand-off between bulls and bears. Found during a strong trend spinning tops "group" can signal of a possible price reversal. However it could be also that a strong trend is only "resting" temporarely, and after a short consolidation, the price will resume its previous direction. | |
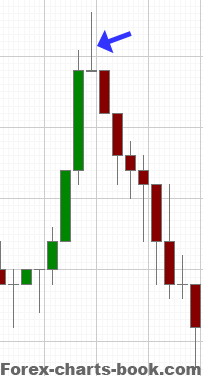
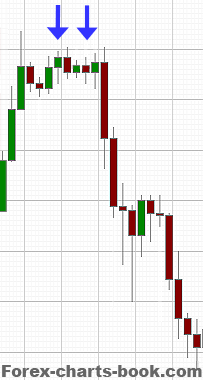
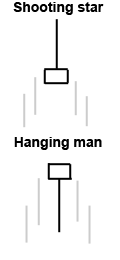 Hanging man and shooting star are bearish signals of potential price reversal. Hanging man and shooting star are bearish signals of potential price reversal.Their distinctive features are: 1) position at the top of a uptrend; 2) really long shadows (2 times more than a real body or longer); 3) small body (color doesn't matter, however, red color would give stronger signal). Long shadows of hanging man are results of strength of forming bears' pressure. Same as for the shooting star — it's apparent that bears managed to stop the price from advancing and seriously pulled it down. Both candlestick patterns require further confirmation (following red candle) before opening new positions. | |
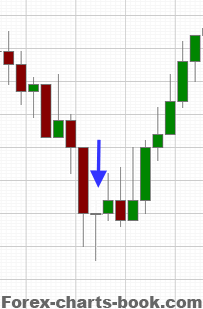
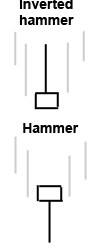 Hammer and inverted hammer candlesticks are result of a growing buyers' pressure when occur at the bottom of a downtrend. Hammer and inverted hammer candlesticks are result of a growing buyers' pressure when occur at the bottom of a downtrend. Although these patterns are signs of a possible trend reversal, they need to be confirmed before taking actions. The green color of a body for hammer as well as inverted hammer is considered as a much stronger bullish signal than the red one. |  |
One final note to add: the bigger the time frame the more value a candlestick formation will have. For example, an hourly candlestick will "overweight" by its importance a candlestick from the 15 minute chart just because its strength is tested over a longer period of time and therefore proved to reflect a situation on the market more realistically.
In simple words, when trader predicts a next price move using hourly candlestick the likelihood for such prediction to become true is way higher than if same predictions was made relying on candlestick from 15 minute chart.
Our next step will be to learn about most common and widely used chart patterns that help traders to predict a future price direction. Continue...
To your trading success!
Jeff Boyd
Copyright © Jeff Boyd Authors & Publishers