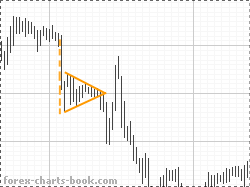
Forex Charts Book. Series of Free Forex ebooks

Educational guide for beginners on exploring Forex charts

 CANDLESTICKSCHART PATTERNS

Pages:     1    2    3    4    5  

 Continuation patterns: the price 85% of the time will continue moving in its previous direction


Flag pattern

forex flag pattern

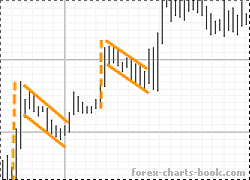
This pattern looks like a small flag with a flagpole. It is a continuation pattern, which means that the price will usually assume its previous direction after breaking out of flag.

When the flag is upside down (the flagpole is above the flag) — the price will continue moving down.

When the flag is in upright position — which means we were in the previous uptrend, the price will continue moving up.

However, there are exceptions from this rule. For example, when we trade in a downtrend and happen to spot a flag in "upright" position, a decision for us to go long from that point would be wrong. Why? Our aim is to trade with a trend (downtrend in this case), therefore only breakouts downwards which are going along with our dominant trend would count as a considered points to open new trades.

Pennant pattern

forex pennant pattern

A pennant or a symmetrical triangle occurs when price action range is slowly narrowing down. Consistent lower highs and higher lows eventually brings price to an apex of a triangle. After being squeezed at the top of a triangle, the price most of the time will breakout from a pennant in the direction of the most recent dominant trend.

Trading strategy for all flags, triangles and pennants: wait for the price to break through the flag (or triangle, or pennant). Place the order after the first bar has been closed outside the pattern.

For more aggressive traders: the order can be placed ahead and right at the anticipated exit from the flag (or pennant, or triangle) pattern.

Ascending triangle

forex ascending triangle pattern

An ascending triangle is a continuation pattern. In our case it is an uptrend and we can see the moment where sellers were trying to resist keeping the same price level (top line) from being passed, and at the same time we also note that buyers were able to push the price up and close each trade with higher results. Eventually sellers could not hold the price at the resistance level and the breakout occurs.

A trading strategy would be again to wait until the price breaks out of a triangle.
Can you locate the next ascending triangle on the picture?

During the downtrend, however, ascending triangles are expected to break down and out, rather than up.

Now let's see what we can learn from the next picture. How we would trade relying only on the knowledge gathered so far.
forex triangles trading chart
Next are reversal patterns.


Pages:     1    2    3    4    5  


 CANDLESTICKSCHART PATTERNS


Copyright © 2006 — 2023 Forex-charts-book.com


Forex trading is a high risk investment. All materials are published for educational purposes only.