Forex Charts Book. Series of Free Forex ebooks
Educational guide for beginners on exploring Forex charts

Forex Charts Book. Series of Free Forex ebooksEducational guide for beginners on exploring Forex charts | |
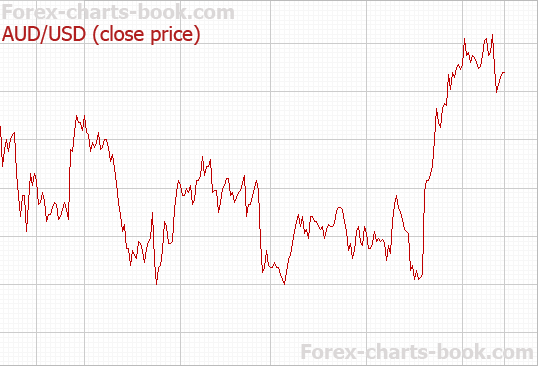
Forex Charts Book. Series of Free Forex ebooksBy Jeff Boyd Contents: Types of chartsThere are three most commonly used types of charts: line chart, bar chart and candlestick chart. It is optional for a trader what chart type to use.Line chart contains price's closing value at given time. Values are then connected in one line, which creates a picture / graph of price fluctuations. Below is an example of a line chart:
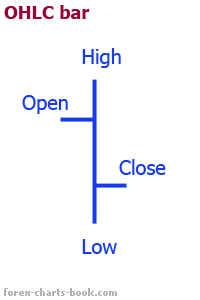
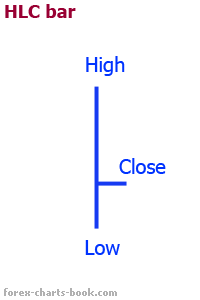
Line charts are useful when making reviews over a long period of time. Bar charts are also called OHLC (HLC) charts. An abbreviation "OHLC" stays for OPEN, HIGH, LOW and CLOSE. Each segment of these charts — a bar — provides a trader with additional information such as high and low ask prices and also open and close prices for certain period of time. In other words, the whole trading range can be observed. Here is a sketch of a bar:
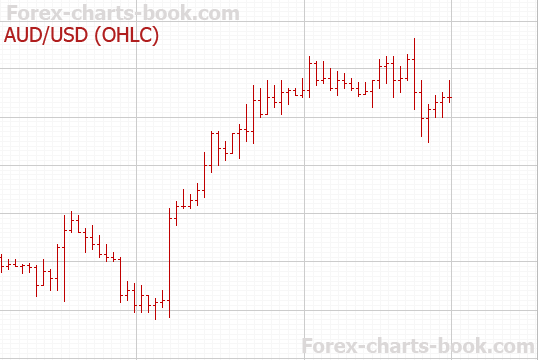
The whole chart also becomes more informative.
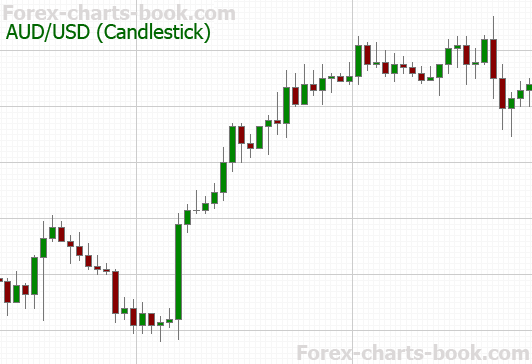
Candlestick charts are an improved version of bar charts. It is Forex most popular and widely used chart type. And we are going to discover why. Each bar of the chart is a candlestick, known also as Japanese candlestick (it was invented by Japanese). First let's take a look at candlestick itself: 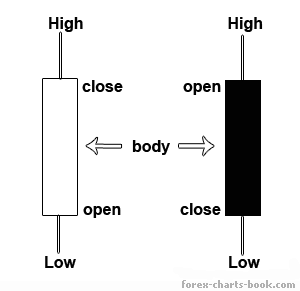 Candlestick carries HIGH, LOW, OPEN, CLOSE for the price and possess a BODY. A color and size of the body supply traders with additional price details. We are going to learn about different candlesticks later.
This chart seems more alive and easier to apprehend visually. That's because a trader can quickly tell where the price went up, where it came down, when the price changed its direction and what happened there. A candlestick chart reveals things that are not visible on other charts. It gives comprehensive information about price on the market and thus helps better understand and predict future price moves.
| ||||||||||||||||||||
READ NEXT ↷
Copyright © 2006 — 2023 Forex-charts-book.com Forex trading is a high risk investment. All materials are published for educational purposes only. |