Forex Charts Book. Series of Free Forex ebooks

Educational guide for beginners on exploring Forex charts

 CANDLESTICKSCHART PATTERNS

Pages:     1    2    3    4    5  

Trend reversal patterns

These patterns signal that current trend is about to end and the opposite trend is coming.

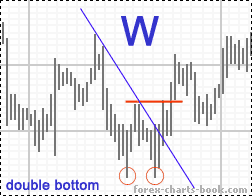
Double top pattern

Double top and double bottom are well known and commonly used chart patterns. They are also easy to spot. Double top pattern appears similar to letter "M", while double bottom pattern can be compared to letter "W".

What is common for these reversal patterns is that on both the attempt to achieve a new higher high (for uptrend) or lower low (for down trend) fails once reaching levels of strong opposite force. When approaching these levels price is pushed back and if there is not enough power to continue the move, the market will prepare to reverse.

Double tops occur when price reaches the new high, retraces back from it, comes up again to re-test that new high, but instead of making next higher point it fails and comes down again. Spotting such case, traders start watching price actions closely. What do they want to see?

forex double top pattern
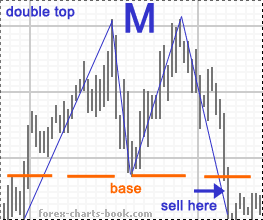
Traders want to see the price going through the base of the double top pattern.

If price drops below that base, a double top pattern is confirmed, and it is a signal to sell.

Also traders watch whether the price fails to break the highest point for the third time — if so, it will become a triple bottom pattern — even more emphasizing that current trend is about to change.
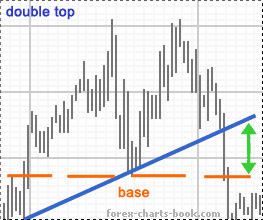
Trend line helps to track those actions even more effectively. If price breaks through the trend line and then follows through in the same direction, this is a strong signal of possible trend reversal.

forex double topThe same picture.
Green arrows show the moment where we start watching the price closely. Our trend line is broken, so when the price goes through the base we know that it is time to place a sell order.

Double bottom pattern works according to the same principles.

Price forms W-shape by reaching a new low, retracing up for a while, then it drops back to re-test that low and finding a strong support moves back higher, breaking the base of the pattern and establishing a new uptrend.

forex double bottom

The picture of double bottom pattern. Almost identical parts form a W-shape: two red circled bottoms where price met strong support and reversed; later we see our trend line gets broken. The base for W-shape is determined and we wait for break-out through this base to occur.

The pattern is confirmed, and the market is providing a signal to buy.


Pages:     1    2    3    4    5  


 CANDLESTICKSCHART PATTERNS


Copyright © 2006 — 2023 Forex-charts-book.com


Forex trading is a high risk investment. All materials are published for educational purposes only.