Forex Charts Book. Series of Free Forex ebooks
Educational guide for beginners on exploring Forex charts

Forex Charts Book. Series of Free Forex ebooksEducational guide for beginners on exploring Forex charts | |
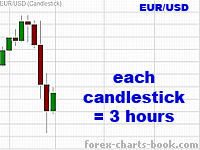
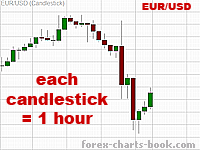
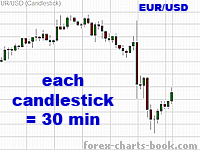
Candlestick appearanceJapanese candlesticks are formed using OPEN, CLOSE, HIGH and LOW for the price at specific time. (When we say "specific time", we mean time measure (time frame) that a trader has chosen to trade in. For example, a trader can trade hourly charts, daily charts, weekly etc. When trading hourly charts, for example, each candlestick will represent 1 hour, which means it will be formed based on data collected during one hour period). Here are examples of different time frames describing same data:
Now let's go back to candlesticks. 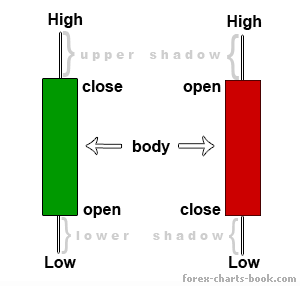 The major part of the candlestick is its body which represents a range between OPEN and CLOSE prices. Bodies can be colored at trader's choice. One of the common set up which we are also going to use for our charts is "red and green". So, "red" will stay for filled candlestick giving a signal that price has dropped, and green will stay for hollow giving a signal that price has gone up. Also we can see price SHADOWS — the extensions above and below the candle body. The very top of the shadow above is called HIGH, the very bottom of the shadow below is called LOW. A bullish or a bearish candlestick... What does that mean? .png) These terms describe two opposing forces on the market: bulls are traders who push the price up, and bears — they pull price down.
| ||||||||||||||||||||||
Copyright © 2006 — 2023 Forex-charts-book.com Forex trading is a high risk investment. All materials are published for educational purposes only. |